Who does what? Statistics for fair households
Feelings versus facts: statistics show in black and white who finished how many tasks. No more debates about felt unfairness – just numbers, charts and fair coexistence.
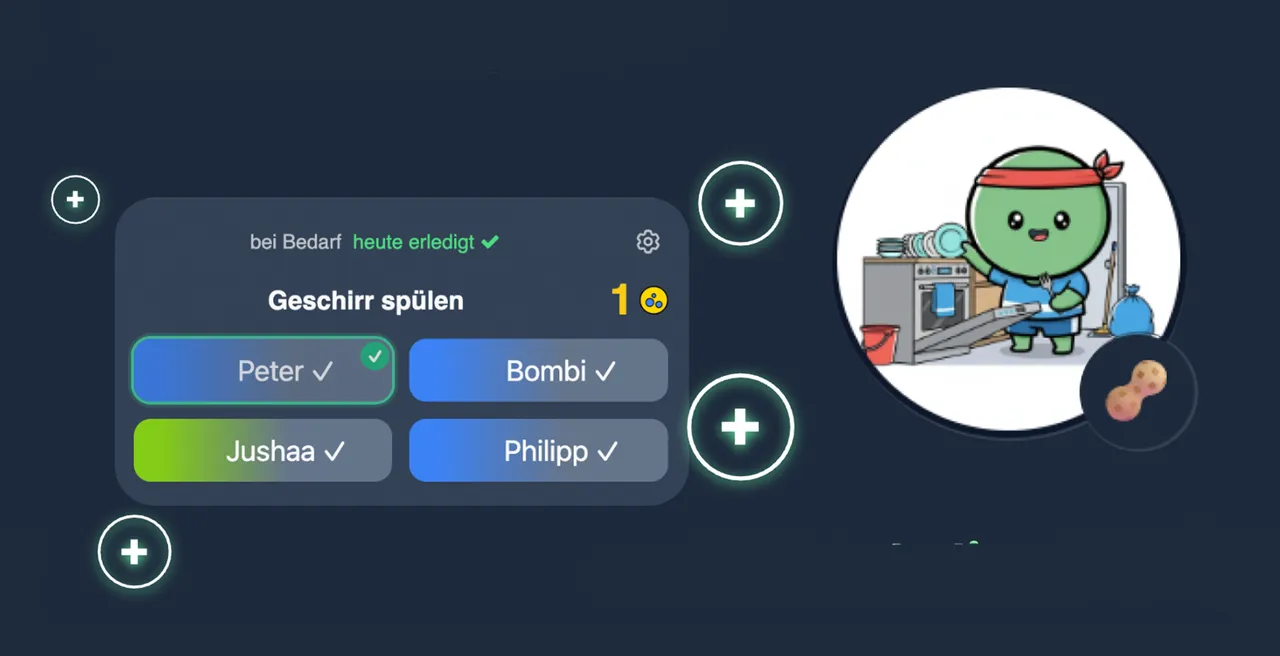
Task distribution at a glance
Bar and pie charts show how tasks and points spread across household members. One glance reveals whether the load is shared fairly or one person permanently carries more.
Reports filter by period: this week, this month or everything. That is how you spot patterns – like the bathroom always sticking to the same person – and rebalance deliberately.
Streaks, heatmaps and trends
Beyond raw points, streak histories and activity heatmaps show how consistently each member participates. Perfect for the weekly household meeting: two minutes of numbers, then redistribute fairly.
In flatshares especially, statistics end the typical conflicts. Instead of blame there are facts both sides accept.
Motivation through visible progress
Seeing your own progress keeps you going: weekly comparisons, personal bests and XP curves make finished work visible. Brains love checked-off lists – and wohnli delivers them beautifully.
All data stays in your household. No ads, no selling usage data – statistics serve only your fairness.
Questions about statistics
Which statistics exist?
Point balances per member, task distribution charts, streak histories, activity heatmaps and weekly or monthly comparisons – all filterable by period.
Does everyone see every number?
Yes, transparency is the principle: all household members see the same reports. That is exactly what makes task distribution fair.
Can statistics be exported?
The overviews are optimized for viewing in the app. One shared look at a phone or tablet is enough for the household meeting.
Goes well with
Make your household measurably fair
Use statistics for freeTidy Up. Level Up.
With wohnli, your individual household buddy.